Hilltop Elementary
1855 Rohrssen Rd., Elgin, IL 60120- Principal: Matthew Decker
- Phone: (847) 289-6655
- Grades Served: PK - 6
The grade range of this school.
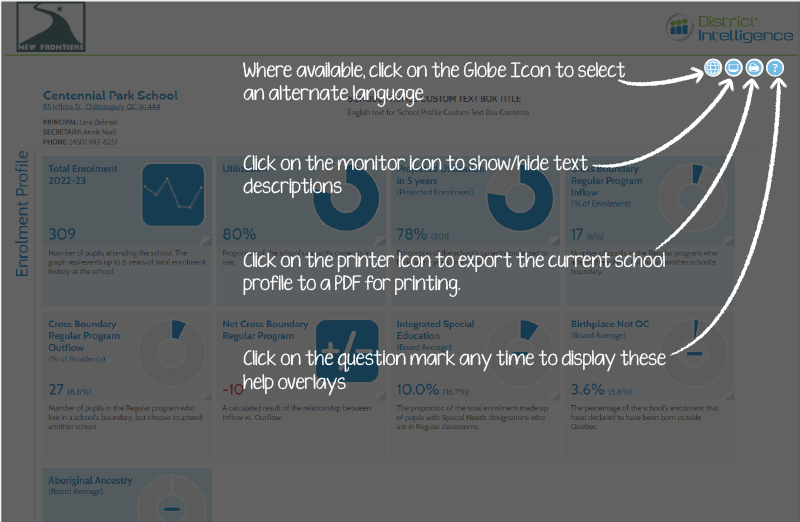
Click on a link to access other sources of school data (pages are hosted outside of District Intelligence).
The average number of students in each class at this school. Source: Illinois School Report (Nov. 2025)
District Average: 89.1%
State Average: 91.6% 93.0%
The average daily attendance at this school. Source: Illinois School Report (Nov. 2025)

District Average: 8.4% 5.8%
The percentage of students who experienced at least one transfer in or out of the school between the first school day of October and the last school day of the year, not including graduates. Source: Illinois Report Card (Nov. 2025)
Change from Previous Year: +6.50% $18,869
School spending per student in the previous school year. Source: Illinois Report Card (Nov. 2025)
Year-over-year trend: +14.8% 17.8%
Proportion of students designated an Individualized Education Program. Source: Illinois Report Card (Nov. 2025)
Year-over-year trend: +16.7% 53.1%
The proportion of students at this school that are eligible to receive free or reduced-price lunches, live in substitute care or whose families receive public aid. Source: Illinois Report Card (Nov. 2025)

District Average: 31%
State Average: 25% 19%
The proportion of students who miss 10% percent or more of school days, either with or without a valid excuse. Source: Illinois Report Card (Nov. 2025)
District Average: 91.8%
State Average: 89.5% 84.6%
The district average for the 3-year average percentage of teachers returning to work at the same school. Source: Illinois Report Card (Nov. 2025)
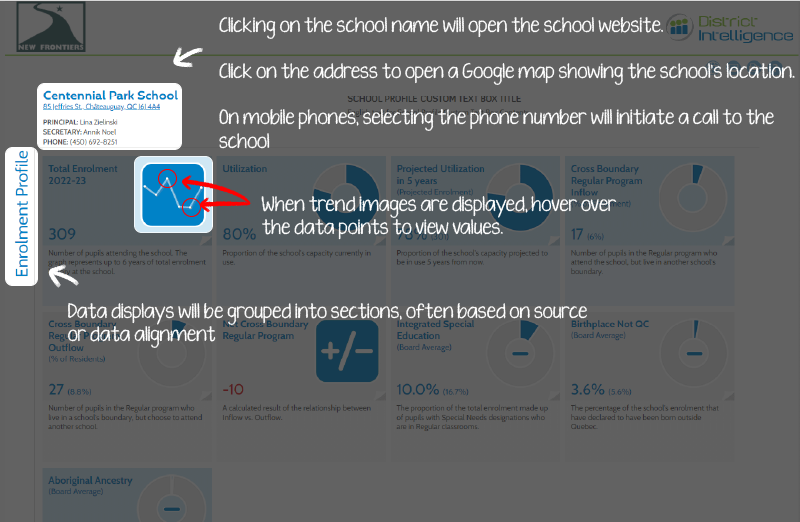
Number of pupils attending the school. The graph represents up to 6 years of total enrollment history at the school. Source: Sept. 30th, 2025 Student Record System
Proportion of the school's capacity currently in use. Source: Sept. 30th, 2025 Student Record System
(District Average) 45.9% (40.2%)
The percentage of pupils residing within this school's boundary that are enrolled in a magnet program at any school within the jurisdiction. Magnet programs include Alternative programs, Dual Language, Early Learning, ELL, Gifted, Private Placement, amongst others. Source: Sept. 30th, 2025 Student Record System
(% of Enrollment) 78 (15.4%)
Number of pupils who attend the school (in any program), but live in another school's attendance area. Source: Calculated base on Sept. 30th, 2025 Student Record System
(% of Residents) 67 (13.5%)
Number of pupils who live within the school's boundary, but choose to attend another school, in any program. Source: Calculated based on Sept. 30th, 2025 Student Record System
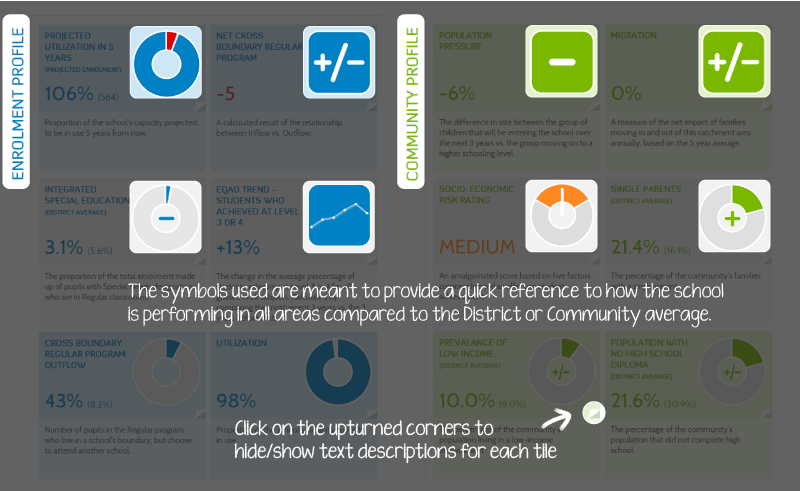
A calculated value based on inflow (U-46 students attending this school who reside in another school's attendance area) minus outflow (U-46 students residing in this school's attendance area who choose to attend other schools in the District). GREEN numeric values indicate a net gain of students to the school, while RED values signify a net loss of students from the attendance area. Source: Calculated based on Sept. 30th, 2025 Student Record System
(District Average) 15.8% (14.1%)
The proportion of the total enrollment made up of pupils with Special Needs designations who are in Regular classrooms. Source: Sept. 30th, 2025 Student Record System
(District Average) 40.9% (31.6%)
The percentage of the school's enrollment receiving ELL services/instruction/funding. Source: Sept. 30th, 2025 Student Record System
District Average: 60% 60%
How often students learn about, discuss, and confront issues of race, ethnicity and culture in school. Source: Panorama Equity and Inclusion Survey (Spring 2025)
District Average: 77% 76%
How diverse, integrated, and fair school is for students from different races, ethnicities or cultures. Source: Panorama Equity and Inclusion Survey (Spring 2025)
District Average: 53% 62%
The degree to which students feel that they are valued members of the school community. Source: Panorama Equity and Inclusion Survey (Spring 2025)
District Average: 74% 72%
Derived from feedback from our high school students to better understand student experience at U-46. Source: Panorama Equity and Inclusion Survey (Spring 2025)
(District Average) 33.2% (31.5%)
Proportion of enrollment that has indicated they are dual language. Source: Sept. 30th, 2025 Student Record System.
(District Average) 47.8% (44.3%)
Proportion of students identified as being a part of either the free or reduced fee lunch program at the school. Source: Sept. 30th, 2025 Student Record System.
(District Average) 17.0% (8.3%)
Proportion of students at the school of Asian ethnicity. Source: Sept. 30th, 2025 Student Record System.
(District Average) 6.5% (6.2%)
Proportion of students of Black/African American ethnicity. Source: Sept. 30th, 2025 Student Record System.
(District Average) 55.7% (58.4%)
Proportion of students who are identified as Hispanic/Latino ethnicity. Source: Sept. 30th, 2025 Student Record System.
(District Average) 15.8% (22.7%)
Proportion of students who are identified as being of White ethnicity. Source: Sept. 30th, 2025 Student Record System.
(District Average) 4.5% (3.3%)
Proportion of students who are identified as being from multiple ethnic origins. Source: Sept. 30th, 2025 Student Record System.
(District Average) 0.2% (0.9%)
The proportion of the school's enrollment that have declared an ethnicity of American Indian or Alaskan. Source: Sept. 30th, 2025 Student Record System.
(District Average) 1.8% (1.9%)
The proportion of students who are identified as currently being without a permanent fixed address. Source: Sept. 30th, 2025 Student Record System.
- Year of Construction: 2003
- Building Footprint: 67,528 Sq. Ft.
- Sq. Ft. per Student: 119
- Site Acreage: 18.45
- Recommended Site Acreage: 10.45
Note: Date of construction refers to the original structure and does not include additions that may have occurred since that time. Site Acreage recommendation based on enrollment by the State of Illinois. Source: DLR Building Snapshot Report (January 2021)
- Spatial Education Adequacy: 7.2 out of 10
- Water Usage: 4.3 Gal./Sq. Ft./Year
- Energy Usage: 56.1 BTU/Sq. Ft.
Spatial Education Adequacy score is based on 4 factors: Physical Features, Environment Supports Variety, Visual Stimulation and Future Readiness. Source: DLR Building Snapshot Report (January 2021)
Letter Grade: C 25%
FCI indicates the overall repair needs of the school building compared to the replacement cost of the building. Generally speaking, a lower % FCI represents an overall better building condition compared to a higher % FCI. Source: DLR Building Snapshot Report (January 2021)
- Aggregated Facility Grade: B-
- Spatial Educational Adequacy: C
- Building Allocation: A
- Water Usage: A
- Energy Usage: D
Facility grades were determined by building assessments.
Spatial Educational Adequacy grades were determined by a survey issued to staff.
Building Allocation grades were determined by building area and enrollment.
Water Usage grades were determined by comparing utility data to the Commercial Buildings Energy Consumption Survey.
Energy Usage grades were determined by comparing utility data to the US Dept of Energy’s Building Performance Database. Source: DLR Building Snapshot Report (January 2021)