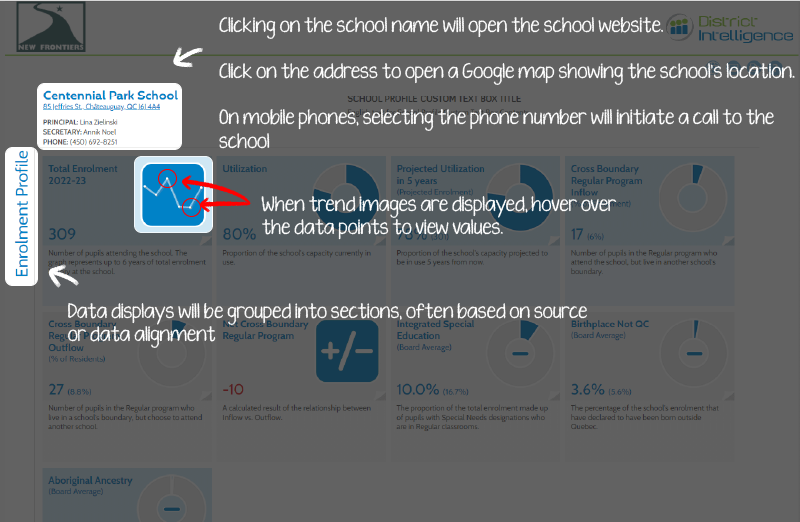
Whitney PS
62 Post St., Whitney, ON K0J 2M0- Principal: Jonathan Pratt
- Secretary: Brittany Olsheskie
- Phone: (613) 637-2171
- Grade Structure: JK - 8
- Program(s) Offered: English with Core French
- Family of Schools: Madawaska
The grade range of this school, program(s) offered (at elementary schools), the family of schools that it belongs to (i.e. the Intermediate/Secondary school into which students transition.)
- Before/After School: Not offered at this school
- Full Time: Not offered at this school
Indication of type of child care programs and names of providers located at open and operating schools. Before and After school care program data as of Sept. 2025, full-time child care program data as of Sept. 2024.
- Total FTE: 9.13
- Teaching FTE: 4.57
- Non-Teaching FTE: 4.6
FTE (Full Time Equivalent) indicates the total number of school staff, including those working partial hours, represented as full time status as of March 2025. Non-Teaching staff refers to the sum of administrative, classroom/student support and other staff.
- Administrative FTE: 1.0
- Classroom/Student Support FTE: 2.7
- Other FTE: 0.86
Breakdown of non-teaching staff FTE into administrative (principal/vice principal), classroom/student support (ECE, ESP, SSC), and other (clerical, custodial). Where elementary and secondary are co-located or K-12 schools, "other staff" are normally captured with the secondary side, while most "classroom/student support" are captured on the elementary side. FTE is as of March 2024 and can change throughout the year.
- Click here to access Renfrew County DSB School Locator.
Use the link above to learn more about Renfrew County DSB schools and find out which schools serve specific addresses.

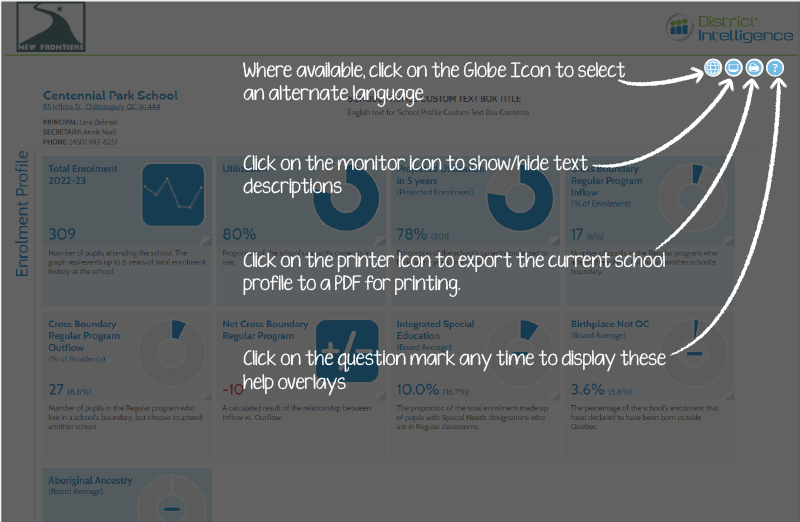
(Utilization - Oct. 2024) 31% (49%)
Total enrolment as a % of permanent pupil spaces (OTG Capacity) in the school. The alternate value provided in brackets represents the previous year's utilization value.
(% of Enrolment) 1 (5%)
Number of pupils in the Regular program who attend the school, but live in another school's boundary. Updated: Fall 2025
(% of Residents) 5 (19.2%)
Number of pupils in the Regular program who live in this school's boundary, but choose to attend another school. Updated: Fall 2025
OTG means "On-the-Ground" capacity and represents the total permanent pupil places in the school as reported in the Ministry of Education's School Facilities Inventory System (SFIS), as of December 2025
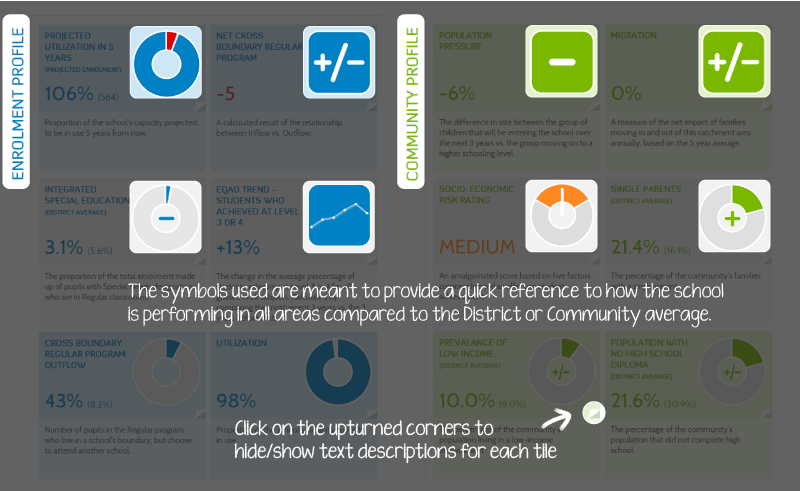
(Board Average) 18.2% (6.4%)
The proportion of the school's Oct. 31st, 2025 enrolment that have self-identified as being of Indigenous descent as per OnSIS/Ministry guidelines.
- Portables (or Portapak): 0
As reported in the Ministry of Education's Capital Information System (ECIS), as of October 2023.

The extent to which the school's 2025-26 enrolment compares to its (OTG) Capacity. A negative value indicates a shortfall of permanent pupil spaces compared to total school capacity (excluding portables). A positive value indicates surplus pupil places compared to total school capacity.
- Total Number of Rooms: 3
- Classrooms: 2
- Kindergarten Classrooms: 1
"Other Areas" includes resource rooms, specialized music rooms, gymnasia and other permanent specialized spaces identified in the School Facilities Inventory System (does not include portable classrooms).
- System Type: Mechanical Ventilation
-
Assessment Complete: Yes
Running Ventilation Systems Longer: Yes - Higher Grade Filters Installed: No
- Increased Filter Changes: No
- Increased Fresh Air Intake: No
Ventilation system type available at the school (ventilation in Portable/Portapak units may differ). Updated: Fall 2022
Board: 1,034 4
Number of standalone HEPA filter units deployed at the school (incl. units in Portables/Portapaks) and the total within the Board. Updated: Fall 2022
(Board Average) 2.5% (11.3%)
The proportion of the school catchment area community's population that move in the year prior to the Census. Source: Census 2021
Click on the link above to access EQAO reports for this school. Updated: April 2026.