- Grade Structure: 9 - 12 Alternative Programs
- Family of School(s): Katarokwi Learning Centre
The grade range of this school including the program(s) offered (at elementary schools), the feeder group of schools that it belongs to (ie. the Intermediate/Secondary school into which its students transition.), and the Trustee Ward that it belongs to. Data Verified: Nov. 2025
- Before/After School: No
Indicates the type of child care program(s) and names of providers located at schools, as of September 2023
- Total FTE: 18.22
- Teaching FTE: 12.00
- Other FTE: 6.22
FTE (Full Time Equivalent) indicates the total number of staff, including those working partial hours, represented as full time status, effective November 2023. Other FTE refers to the non-teaching, administrative, and support/itinerant staff. Data Verified: Summer 2023
- Click here to access Tri-Board Student Transportation routing information.
Use the link above to access Tri-Board Student Transportation Services' Portal to learn more about alerts, schedules, eligibility... etc.
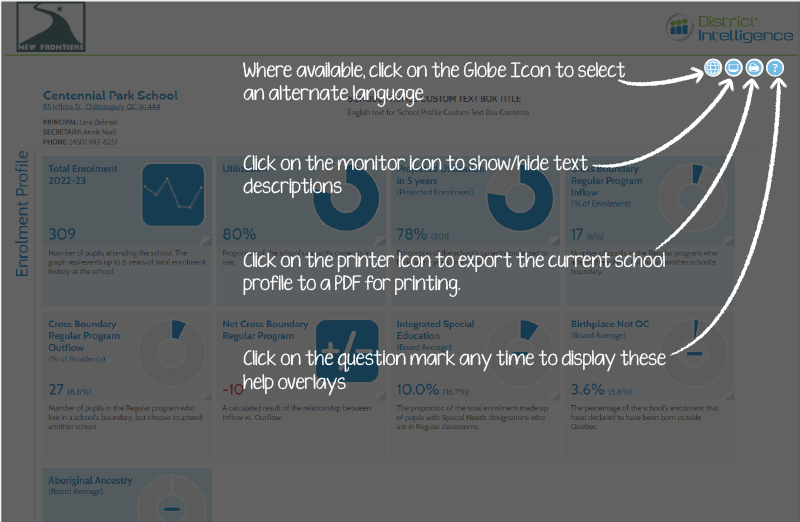
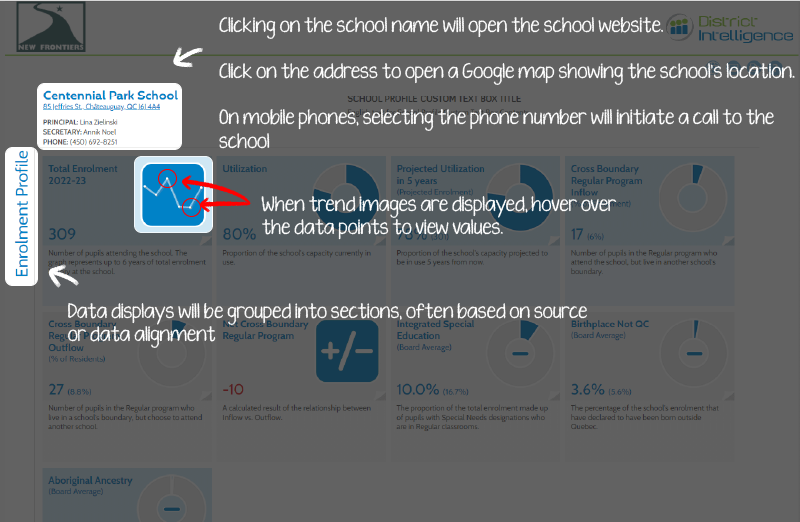
Number of pupils attending the school. The graph represents up to 6 years of total enrolment history at the school.

(%) +63 (53.4%)
The change in total enrolment at this school when compared the enrolment from 5 years ago (all Programs included). Last updated: June 2025
- Date of Construction: 1964
- Size of School Site: 20,234.30 Sq. M.
Note: Date of construction refers to the original structure and does not include additions that may have occurred since that time.

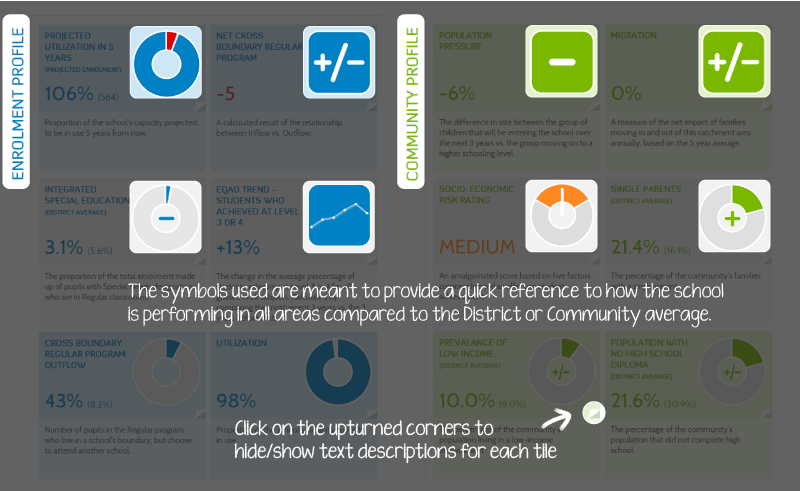
Board Average: 55% 71%
Facility Condition Index (FCI) indicates the overall repair needs of the school building compared to the replacement cost of the building. Generally speaking, a lower % FCI represents an overall better building condition compared to a higher % FCI value.
Board Avg.: 2,713 134
Number of hours of community use recorded at the school is based on Booking Report data system for a 12 month period ending June 30, 2022. Symbol indicates whether school has above average, average, or below average community usage compared to the Board average. Data Verified: Summer 2023
- Longest Distance: 56.90km
The longest and average ride distances between a student's pick up address and the school. Based on data from Transportation consortium. Data updated: Aug. 2025