Swift Waters Elementary School
556 King St W, Brockville, ON K6V 0A7, Canada- Principal: Sarah Stone
- Vice Principal: Mike Crawford
- Office Administrator: Debbie Bradley
ADDITIONAL SCHOOL DETAILS:
* Please refer to the tile below called 'ADDITIONAL INFORMATION' that provides links to a wide variety of information about this school.
- Grade Structure: JK - 6
- Program(s) Offered: Early French Immersion / Regular Core French
- Feeder Group of Schools: Brockville
The grade range of this school, the program(s) offered (at elementary schools), the feeder group of schools that it belongs to (ie. the Intermediate/Secondary school into which its students transition).
- Before/After School: Kampus Kids
- Full Time: Kampus Kids
- Ontario EarlyON: Yes
Indication of type of child care programs and names of providers located at open and operating schools, as of September 2025.
- Total FTE: 46.8
- Teaching FTE: 26.0
- All Other FTE: 20.8
FTE, ('Full Time Equivalent') indicates the total number of active staff, including those working partial hours, represented as full time status, effective October 2024. 'All Other Staff' refers to the sum of non-teaching, administrative, and support/itinerant staff.
- Non-Teaching FTE: 5.0
- Administrative FTE: 2.0
- Support/Itinerant FTE: 13.8
Breakdown of active non-teaching staff into Administration, Classroom Support/Itinerant, and Other full time equivalency. Count of FTE is effective October 2024 and can change throughout the year.
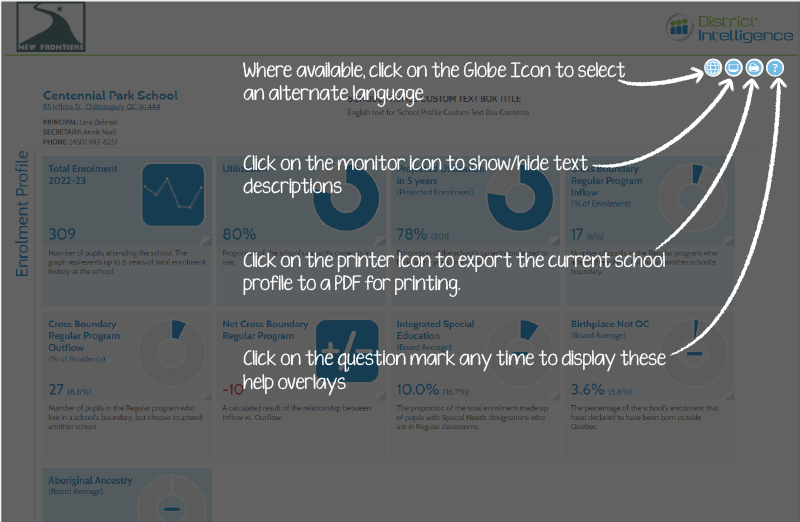
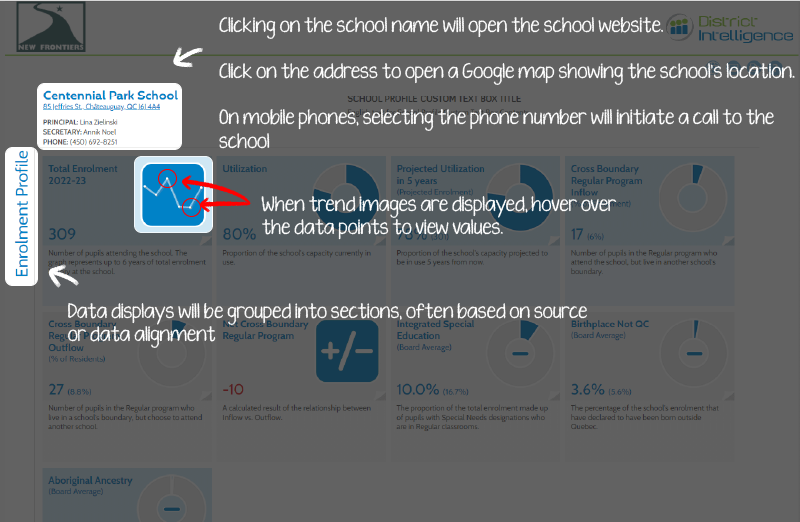
Click on the links above to access more information about this school and the Upper Canada District School Board. NOTE: If you are prompted to "sign-up" with Dropbox to access this information, please close the dialogue box and proceed. You do not need to be a member of drop-box to access this information.
Enrolments shown represent student headcount reported for October 31, 2024. Hover over the data points in the graph to see the total school enrolment by year.

(Utilization - Oct. 2023) 82%
Total enrolment as a % of permanent pupil spaces (OTG Capacity) in the school. The alternate value provided in brackets represents the previous year's utilization figure. Intermediate and Secondary enrolments and capacity are combined for grades 7-12 schools.
OTG means "On-the Ground" capacity and represents the total permanent pupil places in the school as reported, as of October 2024, in the Ministry of Education's School Facilities System.
- Portables: 0
As reported in the Ministry of Education School Facilities System, as of November 2024.

The extent to which the school's 2024 enrolment compares to its (OTG) Capacity. A negative value indicates a shortfall of permanent pupil spaces compared to total school capacity (excluding portables). A positive value indicates surplus pupil places compared to total school capacity.
(% of Enrolment) 68 (31%)
Number of pupils in the Regular program who attend the school but live in another school's boundary (Updated Fall 2025).
(% of Residents) 55 (26.4%)
Number of pupils in the Regular program who live in a school's boundary but choose to attend another school (Updated Fall 2025).
(Board Average) 0.3% (3.7%)
The percentage of the school's 2025 enrolment that have self-identified as being of Indigenous descent within the Student Information System.
- Date of Construction: 2024
- Size of School Site: 5.80 Hectares
- Building Area: 4475.00 Sq. m.
Note: Date of construction refers to the original structure and does not include additions that may have occurred since that time.
- Regular Classrooms: 17
- Kindergarten Classrooms: 4
- Other Areas: 43
"Other areas" include resource rooms, specialized music rooms, gymnasia and other permanent specialized spaces as identified in the Ministry's Education Capital Information System (October 2024) . Does not include portable classrooms. Updates to rooms resulting from 2024 completed construction are accounted for.
-
The Upper Canada District School Board provides regulatory documentation reports on energy consumption details for the board, water quality information and the status of ventilation at each school.
Click here to view.
Visit the link above to view additional facility regulatory documentation.

(Board Average) 595.5 (684.7)
Number of hours of community use recorded at the school is based on Booking Report data system for a 12 month period ending June 30, 2025. Symbol indicates whether school has above average, average, or below average community usage compared to the Board average.
- Shortest Distance: 0.4 km
- Longest Distance: 49.3 km
- Average Distance: 4.8 km
The shortest, longest, and average distance, in kilometers, of the distance between a student's home address to the school. Based on data from STEO, October 31 2024.
Total number and percent of students who walk to school. Based on data from STEO, October 31 2024.
Number and percent of students that are eligible for transportation based on their home address, under the school board policy. Based on data from STEO, October 31 2024.
Number and percent of students that are not eligible for transportation based on their home address, under the school board policy. Based on data from STEO, October 31 2024.
- Shortest: 3 minute(s)
- Longest: 58 minute(s)
- Average: 12.2 minute(s)
The shortest, longest, and average school bus ride times for students to the school (in minutes). Based on data from STEO, October 31 2024.
The change in the average number of births per year. Calculated by comparing the most recent 3 years vs. the 3 years before that.
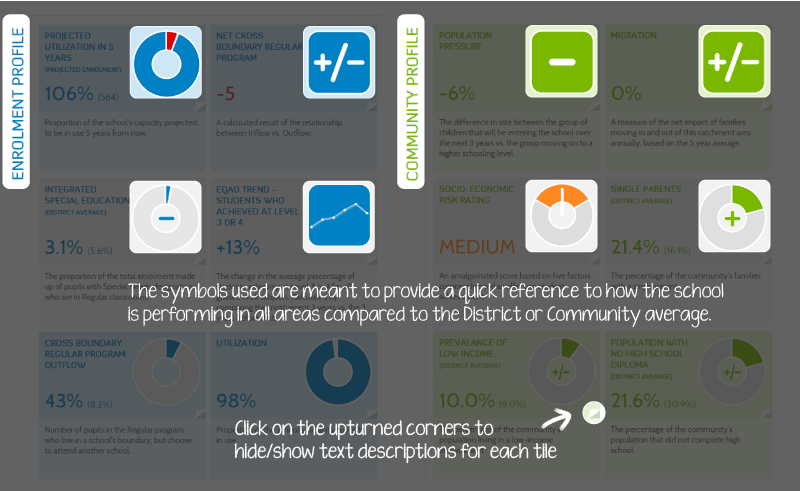
The difference in size between the group of children that will be entering the school over the next 3 years vs. the group moving on to a higher schooling level.
A measure of the net impact of families moving in and out of this catchment area annually, based on the 5 year average.
(Board Average) 41.0% (28.7%)
The proportion of the community's families with a single parent (with children at home). Source: Census 2021
(Board Average) 13.4% (8.7%)
The proportion of the community's labour force that are unemployed (Ages 15+). Source: Census 2021
(Board Average) 2.3% (1.6%)
The proportion of the community's population (ages 0-17) living in a household with an income below a threshold calculated by Stats. Can. using median after-tax income and household size. Source: Census 2021
(Board Average) 11.4% (9.9%)
The proportion of the community's population that did not complete high school (Ages 25-64). Source: Census 2021
(Board Average) 13.5% (10.3%)
The proportion of the community's population that move in the year prior to the Census. Source: Census 2021
(Board Average) 2.8% (17.5%)
The proportion of the community's population that does not speak English at home. Source: Census 2021