- Grade Structure: 7 - 8 French Immersion
- Family of School(s): Frontenac SS
The grade range of this school including the program(s) offered (at elementary schools), the feeder group of schools that it belongs to (ie. the Intermediate/Secondary school into which its students transition.), and the Trustee Ward that it belongs to. Data Verified: Nov. 2025
- Before/After School: No
Indicates the type of child care program(s) and names of providers located at schools, as of September 2023
- Total FTE: 13.98
- Teaching FTE: 12.64
- Other FTE: 1.34
FTE (Full Time Equivalent) indicates the total number of staff, including those working partial hours, represented as full time status, effective November 2023. Other FTE refers to the non-teaching, administrative, and support/itinerant staff. Data Verified: Summer 2023
- Click here to access Tri-Board Student Transportation routing information.
Use the link above to access Tri-Board Student Transportation Services' Portal to learn more about alerts, schedules, eligibility... etc.
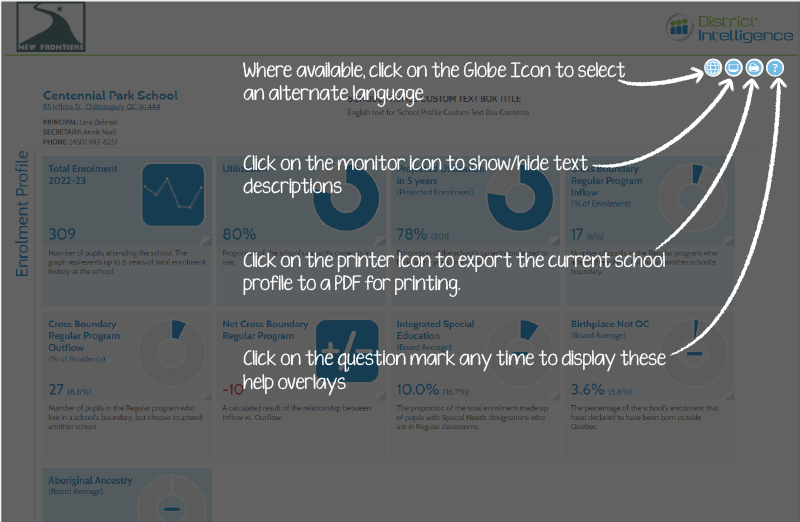
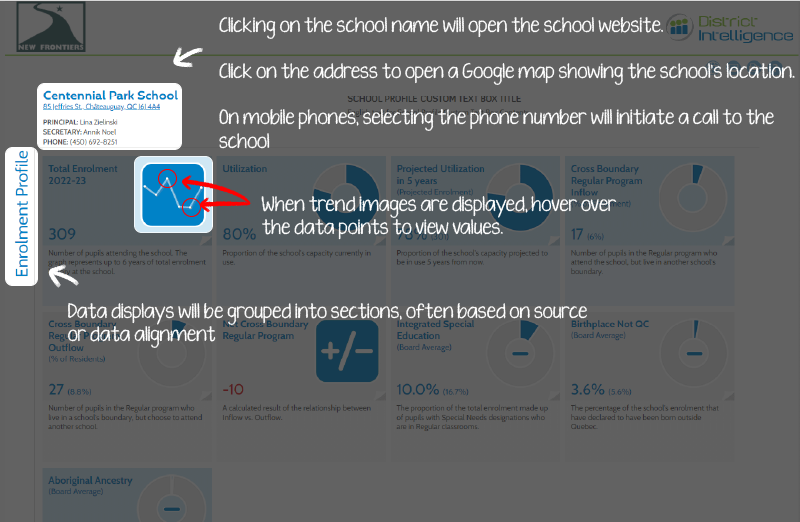
Number of pupils attending the school. The graph represents up to 6 years of total enrolment history at the school.

(%) +33 (15.4%)
The change in total enrolment at this school when compared the enrolment from 5 years ago (all Programs included). Last updated: June 2025

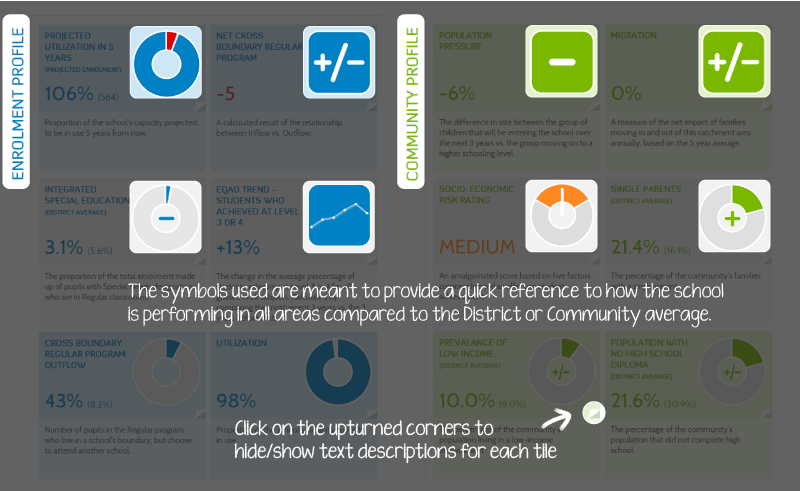
(Projected Enrolment) 152% (244)
Proportion of the school's capacity projected to be in use 5 years from now.
- Date of Construction: 1957
Note: Date of construction refers to the original structure and does not include additions that may have occurred since that time.
Capacity value represents the total permanent student spaces in the school as reported in the Ministry of Education's School Facilities Inventory System (SFIS), as of April 2024.
- Total Number of Classrooms: 9
"Other Areas" include resource rooms, specialized music rooms, gymnasia and other permanent specialized spaces identified in the School Facilities Inventory System (does not include portable classrooms). Data updated: Spring 2024
Board Average: 55% 69%
Facility Condition Index (FCI) indicates the overall repair needs of the school building compared to the replacement cost of the building. Generally speaking, a lower % FCI represents an overall better building condition compared to a higher % FCI value.
- Longest Distance: 64.94km
- Average Distance: 26.60km
- Board Average Distance: 26.60km
The longest and average ride distances between a student's pick up address and the school. Based on data from Transportation consortium. Data updated: Aug. 2025
Board Avg.: 55.5% 75.0% (273)
Proportion and number of students eligible for transportation under School Board policy as administered by the Transportation consortium. Data updated: Aug. 2025