Killaloe PS
100 Queen St., PO Box 189, Killaloe, ON K0J 2A0- Principal: Jude Kelley
- Secretary: Erin Mask
- Phone: (613) 757-2091
- Grade Structure: JK - 8
- Program(s) Offered: English with Core French
- Family of Schools: Madawaska
The grade range of this school, program(s) offered (at elementary schools), the family of schools that it belongs to (i.e. the Intermediate/Secondary school into which students transition.)
- Before/After School: Kidz Kastle Childcare Centre
- Full Time: Kidz Kastle Childcare Centre
Indication of type of child care programs and names of providers located at open and operating schools. Before and After school care program data as of Sept. 2025, full-time child care program data as of Sept. 2024.
- Total FTE: 19.29
- Teaching FTE: 8.45
- Non-Teaching FTE: 10.8
FTE (Full Time Equivalent) indicates the total number of school staff, including those working partial hours, represented as full time status as of March 2025. Non-Teaching staff refers to the sum of administrative, classroom/student support and other staff.
- Administrative FTE: 1.0
- Classroom/Student Support FTE: 7.4
- Other FTE: 2.44
Breakdown of non-teaching staff FTE into administrative (principal/vice principal), classroom/student support (ECE, ESP, SSC), and other (clerical, custodial). Where elementary and secondary are co-located or K-12 schools, "other staff" are normally captured with the secondary side, while most "classroom/student support" are captured on the elementary side. FTE is as of March 2024 and can change throughout the year.
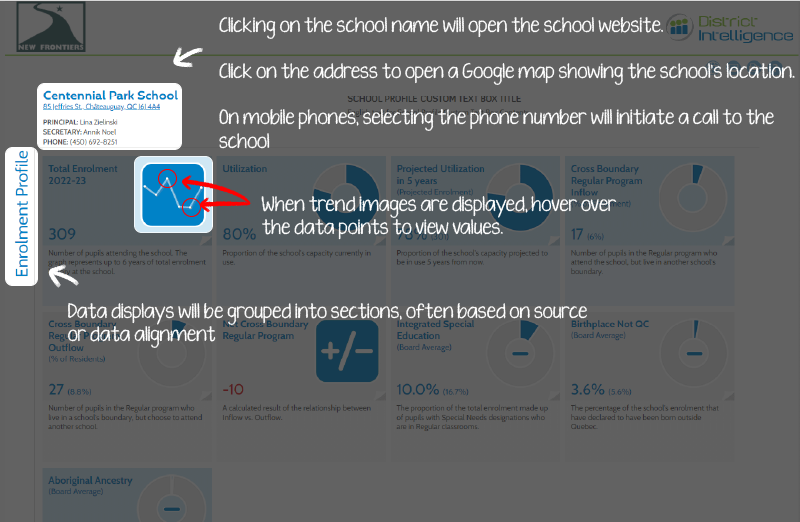
- Click here to access Renfrew County DSB School Locator.
Use the link above to learn more about Renfrew County DSB schools and find out which schools serve specific addresses.

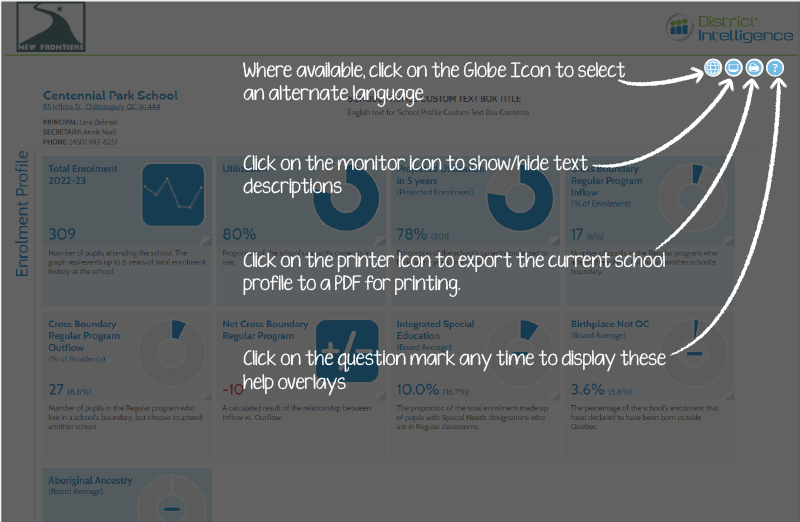
(Utilization - Oct. 2024) 53% (59%)
Total enrolment as a % of permanent pupil spaces (OTG Capacity) in the school. The alternate value provided in brackets represents the previous year's utilization value.
(% of Enrolment) 8 (8%)
Number of pupils in the Regular program who attend the school, but live in another school's boundary. Updated: Fall 2025
(% of Residents) 12 (11.7%)
Number of pupils in the Regular program who live in this school's boundary, but choose to attend another school. Updated: Fall 2025
OTG means "On-the-Ground" capacity and represents the total permanent pupil places in the school as reported in the Ministry of Education's School Facilities Inventory System (SFIS), as of December 2025
(Board Average) 6.1% (6.4%)
The proportion of the school's Oct. 31st, 2025 enrolment that have self-identified as being of Indigenous descent as per OnSIS/Ministry guidelines.
- Portables (or Portapak): 0
As reported in the Ministry of Education's Capital Information System (ECIS), as of October 2023.

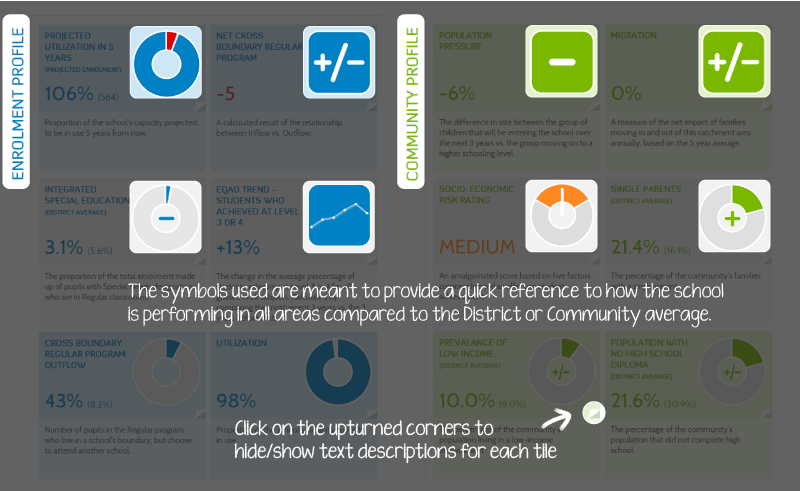
The extent to which the school's 2025-26 enrolment compares to its (OTG) Capacity. A negative value indicates a shortfall of permanent pupil spaces compared to total school capacity (excluding portables). A positive value indicates surplus pupil places compared to total school capacity.
- Date of Construction: 1992
- Size of School Site: 4.65 Hectares
- Building Area: 2,415.4 Sq. m.
Note: Date of construction refers to the original structure and does not include additions that may have occurred since that time.
- Total Number of Rooms: 15
- Classrooms: 7
- Kindergarten Classrooms: 1
- Other Areas: 7
"Other Areas" includes resource rooms, specialized music rooms, gymnasia and other permanent specialized spaces identified in the School Facilities Inventory System (does not include portable classrooms).
(Board Average) 16% (30%)
Facility Condition Index (FCI) indicates the overall repair needs of the school building compared to the replacement cost of the building. Generally speaking, a lower % FCI represents an overall better building condition compared to a higher % FCI. The alternate figure provided in brackets represents the average FCI of all RCDSB school buildings overall. Information on the assessed condition of Ontario schools is gathered in five year cycles, with the exception being no assessments completed during the COVID years. The first cycle was 2011 to 2015, the second cycle was 2016 to 2020, with the current cycle being 2023 to 2027.
(Board Average) $440 ($302)
Total 2023-24 utility costs (heating, electricity and water) of the school divided by total October 31, 2024 enrolment. Value displayed is dollars per pupil.
(Board Average) $20 ($19)
Total 2023-24 utility costs (heating, electricity and water) of the school divided by the size of the building footprint. Value is dollars per square metre.
-
-Heat Exchanger Pipe
-Gym floor replacement
List of all capital projects that were completed in 2023-24 year. BAS refers to Building Automation System(s), AHU refers to Air Handling Unit(s), where applicable. Data updated: Dec. 2024
(Board Total) 338 (24,411)
Number of hours of community use recorded at the school is based on Booking Report system data for a 12 month period between September 1, 2024 and August 31, 2025. Symbol indicates whether school has above average, average, or below average community usage compared to the Board average (amongst schools that have facilities eligible to participate) .
- System Type: Mechanical Ventilation
-
Assessment Complete: Yes
Running Ventilation Systems Longer: Yes - Higher Grade Filters Installed: Yes
- Increased Filter Changes: Yes
- Increased Fresh Air Intake: Yes
Ventilation system type available at the school (ventilation in Portable/Portapak units may differ). Updated: Fall 2022
Board: 1,034 27
Number of standalone HEPA filter units deployed at the school (incl. units in Portables/Portapaks) and the total within the Board. Updated: Fall 2022
The change in the average number of births occurring per year to women residing within this school's boundary. Calculated by comparing the most recent 3 years vs. the 3 years before that.
The difference between the group of children that will be eligible to enter the school over the next 3 years vs. the group aging out of the school (4 years is used in schools with small youth populations).
A measure of the net impact of families moving in and out of this catchment area annually, based on the 5 year average.
(Board Average) 6.8% (11.3%)
The proportion of the school catchment area community's population that move in the year prior to the Census. Source: Census 2021
Click on the link above to access EQAO reports for this school. Updated: April 2026.
("I am not sure") 62.0% (23.0%)
The proportion of students in grade 3 who indicated "Yes, I agree" they like to read on the student questionnaire. Source: 2024-25 EQAO
("I am not sure") 38.0% (46.0%)
The proportion of students in grade 3 who indicated "Yes, I agree" they like to write, on the student questionnaire. Source: 2024-25 EQAO
("I am not sure") 69.0% (8.0%)
The proportion of students in grade 3 who responded "Yes, I agree", that they like math, in the student questionnaire. Source: 2024-25 EQAO
Board Average: 64%
Provincial Average: 75% 66%
The proportion of elementary school students with a positive sense of belonging. Source: OurSCHOOL Survey, site updated: Oct. 2021.
Board Average: 79%
Provincial Average: 84% 79%
The proportion of elementary students with positive relationships. Source: OurSCHOOL Survey, site updated: Oct. 2021.
Board Average: 52%
Provincial Average: 60% 55%
The proportion of students who feel safe at school, as well as travelling to/from school. Source: OurSCHOOL Survey, site updated: Oct. 2021.
Board Average: 27%
Provincial Average: 28% 22%
The proportion of elementary students who are subjected to physical, social, verbal bullying, or are bullied over the internet (moderate to severe level). Source: OurSCHOOL Survey, site updated: Oct. 2021.